
[ad_1]
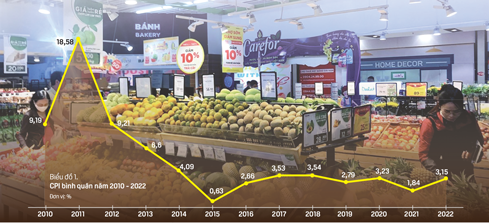
After several years of high growth, from 2014 to 2022, CPI growth slowed and was often below the target set in the National Assembly resolution. There are years of very low growth (like 2015, 2021); 9 year average growth only 2.83% – relatively low compared to the target (4%). This is considered a relatively long-term success.
Especially in 2022, this result is very interesting and is also considered unexpected in the context of a year of unpredictable fluctuations.
2022 – THE 9TH YEAR OF TARGET-CONTROLLED INFLATION
The compound annual CPI growth rate from 2010 to present is shown in Figure 1.
Since the end of 2021, some experts have warned of the possibility of inflation exceeding the target in 2022 (perhaps even up to 5.5%). When inflation in many countries of the world is at its highest level compared to a few decades ago and is several times higher than the orientation (about 2%), it is hard to believe that Vietnam’s average annual CPI will continue in 2022 , but the actual increase was less than the target (although Vietnam’s target was twice that of many countries).
Depending on the calculation method (Average CPI and CPI in December this year compared to December last year – CPI after one year), there is a difference between the two calculation methods – that is, the average annual CPI increase is lower than the CPI after one year – December this year compared to December last year (3.15% vs. 4.55%). This proves that the annual average CPI has eliminated the erratic “up/down” of year-end (month) periods; but for savings, borrowing/debt repayments, time CPI rather than average CPI is typically used; At the same time, it is also a signal that next year’s average CPI will be higher than the CPI at this point (e.g. 2011, 2012, 2013, 2014, 2017, 2018, 2020).
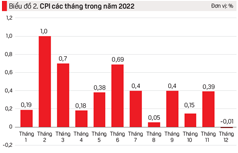
Over time (month-by-month compared to the previous month), the monthly CPI in 2022 is shown in chart 2.
In the 12 months of 2022 there are 5 months of low rise and fall (January, April, August, October, December); There were 7 high increase months, of which 3 months increased quite a lot (February was Lunar New Year, March and June).
By consumer goods and services group12-month CPI and this year’s average CPI compared to last year are shown in Chart 3.
Group of groceries and food services – the group with the highest share of the total value of consumer goods and services (36.12%) – after one year, the growth rate is higher than the average growth rate (5.21% vs. 2.55%). This is an important factor that is helping to ease the pressure on the CPI overall. Within this commodity group, groceries accounted for the highest proportion (22.6%), which increased more than the average annual rate (2.91%) after one year, which contributed significantly to the small increase in the general CPI. The group that eats outside the family (9.06%) has grown quite significantly this year thanks to the elimination of the Covid-19 pandemic, averaging 2.44% per year.
Group of clothes, shoes and hats (accounting for 6.37% of the total), the increase was less than the overall growth rate for both calculation methods, where the average growth rate was low; mainly due to oversupply in the country with large exports.
Group of housing and building materials (with a fairly high share of 15.73%), which increases after a year higher than the general rate in the calculation, mainly due to the high prices of building materials, starting from iron and steel, through cement, then to rare sand twice as expensive, but due to the recent fall in iron, steel and cement prices, the average increase is still small, only half as much after a year.
Group of devices and household appliances (7.31%), the increase was below the overall growth rate, where the average increase after one year was small.
Group of medicines and medical services (accounting for 5.04% of the total) the increase was small for both methods, with the average increase for the whole year being just 0.49%. The prices of this group increased only slightly, mainly due to a relatively long period of time when patients rarely went to the hospital, low drug prices in health insurance, etc.
Culture, entertainment and tourism group (4.29% of the total) was higher than the overall CPI after one year, but lower on average (3.1%).
Group of other goods and services (which accounts for 3.3% of the total) has risen lower than the overall CPI rate as consumers are still focused on basic necessities (like eating, eating), travel and tourism. ..
Among 11 groups, there are 2 groups with a decrease in the average CPI: Post and Telecom (with a share of 2.89%) have decreased in both calculation methods in which the average has decreased. Mainly because this product has a lot of production, advanced technology and technology, large export, large import,…; Education (5.99%) rose quite sharply after one year, but the average increase was small, but prices have tended to rise in recent months (up 5.84% in September, 2.35 in October), %, in December up 0.32% %).
Of the 11 groups, only one group exceeded the overall CPI. Traffic prices (9.37%) rose lower in the one-year calculation, but rose very sharply in the average annual calculation due to the rise in world gasoline prices and weak management, etc.
The inflation control results of the 2022 target were achieved due to many factors.
The first, The general factor is the relationship between total supply and total demand. This ratio is viewed in the form of two prices (actual price and comparison price).
GDP production in 2022 in real prices is estimated at Dong 9513.3 trillion, an increase of nearly 12.2% or Dong 1033.6 trillion higher than in 2021, higher than the growth rate and growth rate of 2020 (around 4.38% and Dong 397.2 trillion) in 2021 (increase of 5.36% and Dong 435.7 trillion); higher than the growth rate of 9.96% and the increase of VND 698.2 trillion in 2019 compared to 2018 – a high growth year before the pandemic.
GDP in 2022 at constant prices is estimated at VND 5545.7 trillion or an increase of VND 411.8 trillion compared to 2021 – higher than the growth rate and the growth rate of 2020 (up 2.87% or 139.5 trillion dong) in 2021 (2.56% increase or 128.2 trillion dong); higher than the growth rate and the growth rate of 2019 compared to 2018 (an increase of 7.36% or an increase of VND333.6 trillion).
Therefore, in 2022, whether measured in real prices or in constant prices, domestic supply (manufacturing GDP) will also increase regardless of the growth rate or growth rate, representing the post-conflict economic recovery.
While the growth and size of GDP in the country increased sharply, the increase in aggregate demand in the country showed remarkable signs.
In terms of GDP usage, GDP at constant prices in 2022 increased by 8.02% or VND411.8 trillion, but accumulated wealth increased by only 5.75% or VND110.6 trillion, while final consumption only rose by 7.18% or 241.4 trillion Dong. Adding these two items rose by 6.66% or VND352 trillion – both lower than the corresponding GDP figures. Hence goods were in surplus and services were in surplus.
Wealth accumulation is a prerequisite for investment, and investment is a direct factor that determines economic growth. Investment efficiency has increased quite well this year, when the ICOR coefficient has dropped to about 6 times compared to 2 years ago (2020 is 14.27 times, 2021 is 15.54 times), and this is an important factor contributing to the reduction of inflationary pressures. However, the ratio of investment capital for social development to GDP in 2022 will reach 33.8% – lower than many previous years (2016: 34.17%, 2017: 35%, 2018: 34.62%, 2019: 34.65 %, 2020: 34.85%, 2021). is 34.1%, the average period 2016-2021 is 34%).
Readers can order Economy 2022-2023: Vietnam and the World here.
https://postenp.phaha.vn/chi-tiet-toa-soan/tap-chi-king-te-viet-nam
[ad_2]
Source link